INTRODUCTION
FEATURES
Most charting packages offer a similar, fixed and limited collection of standard technical indicators. ProTA itself includes more than 50 built-in, industry standard indicators, all them a simple click or drag and drop away.
But the field of technical analysis is constantly evolving. New analytical methods are published every month in new books, trade magazines, web publications, or even by TA software users such as yourself.
One of the key features setting ProTA apart from the alternatives is the virtually unlimited and unique analysis potential provided through
Custom Indicators written in ProTAscript.
ProTAscript is a simple yet powerful formula-building language, exclusive to ProTA. If you have ever written a formula in a spreadsheet application, you are already well on your way to understanding ProTAscript.
Analysis without limitation
ProTAscript formulas can range in scope from simple one-liners based on existing indicators, all the way up to complex, multi-output studies based on your own unique analysis ideas.

This simple Custom Indicator uses the MA function to plot a 21 period Moving Average shifted upward by 5 points.

Here we compute a custom index, averaging the prices of 3 different securities using the XREF function to add then divided by 3.
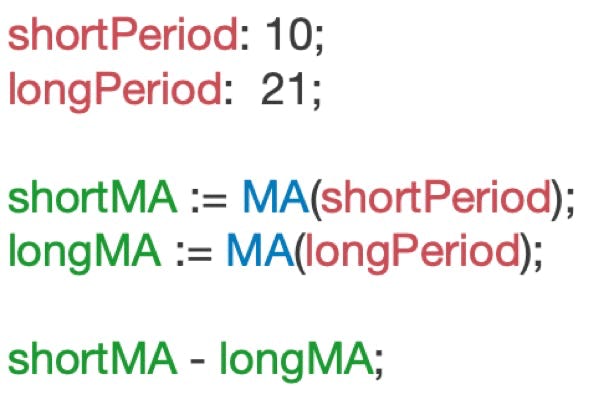
Multiple lines of code are used here to aid readability and add flexibility.
The output comes from the final line of code, in this case an oscillator plotting the difference between two moving average lines.
With ProTAscript, your unique and custom analysis can be utilized throughout the application. For example, in the chart suite below, Custom Indicators were used in three separate ProTA features:
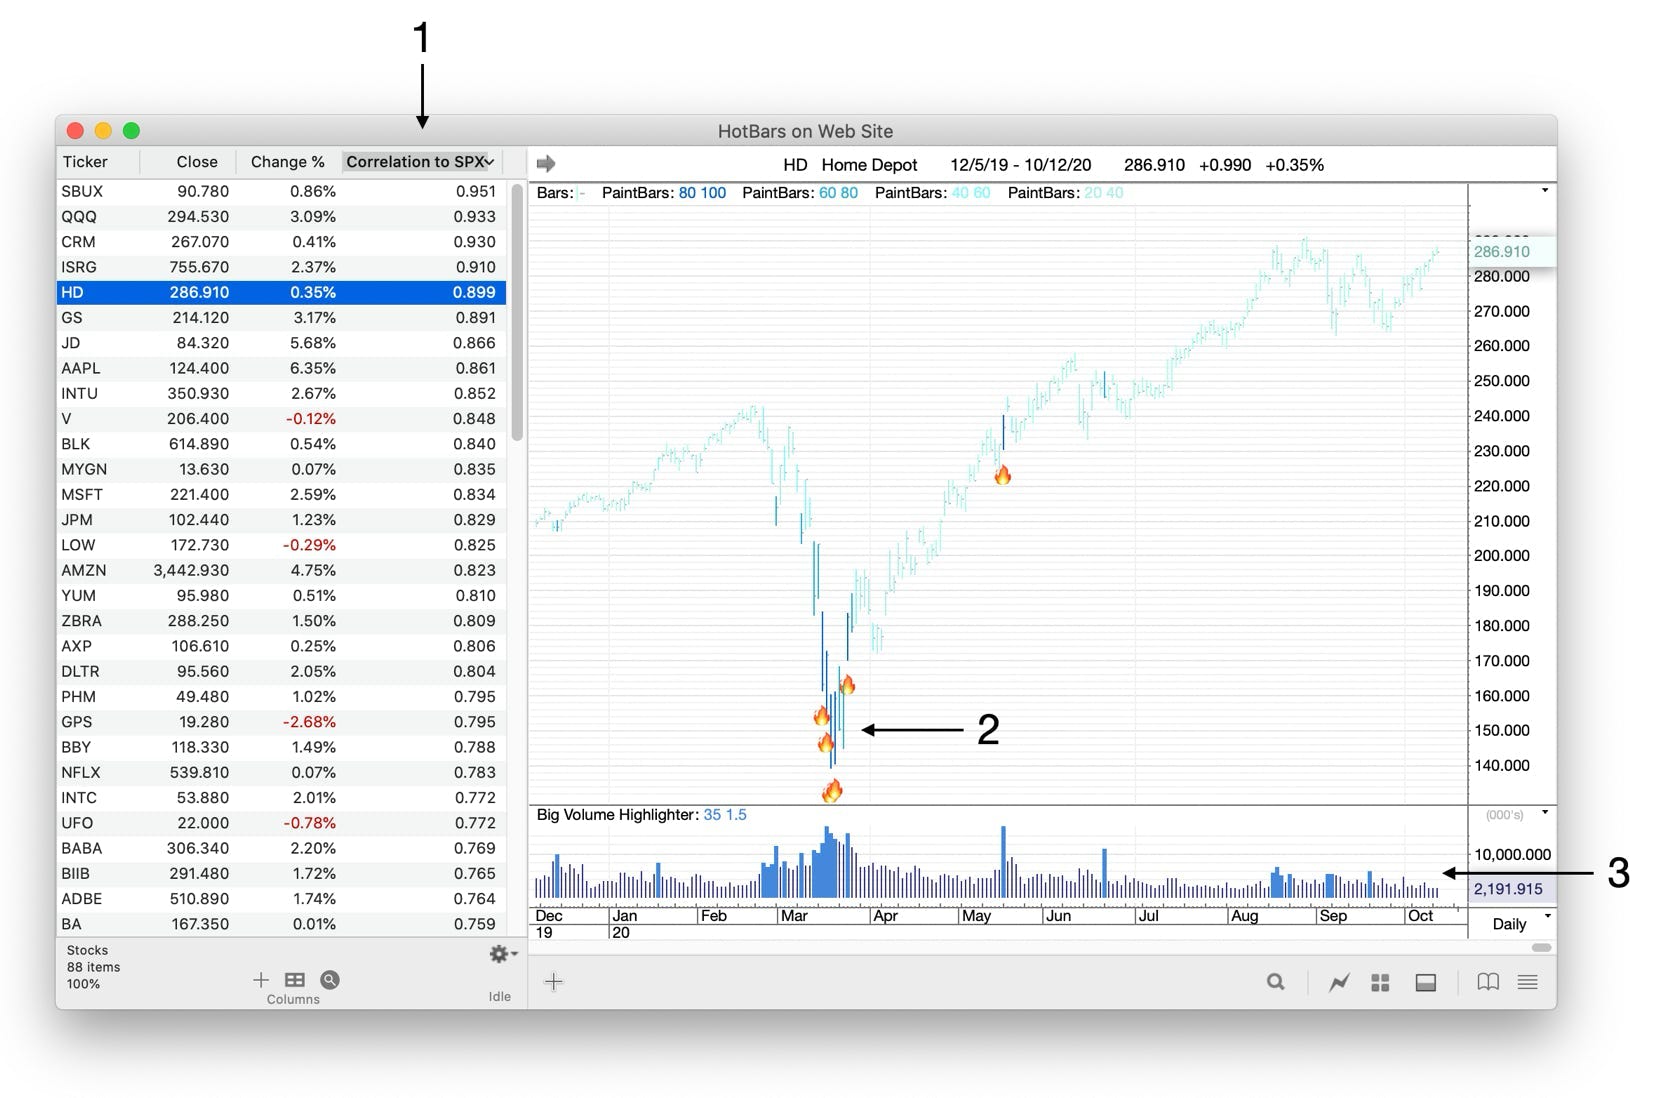
1
A custom, sortable column. In this case, a simple one-line ProTAscript was used to compute the statistical correlation coefficient (r-squared) between each stock vs. the S&P 500.
2
A “Hot Bars” Custom Indicator was written to place 🔥markers on all potential Buy locations, based upon our own custom bullish indicators.
3
A Custom Indicator plot was overlaid onto the traditional Volume plot to highlight extraordinarily large jumps in daily Volume.
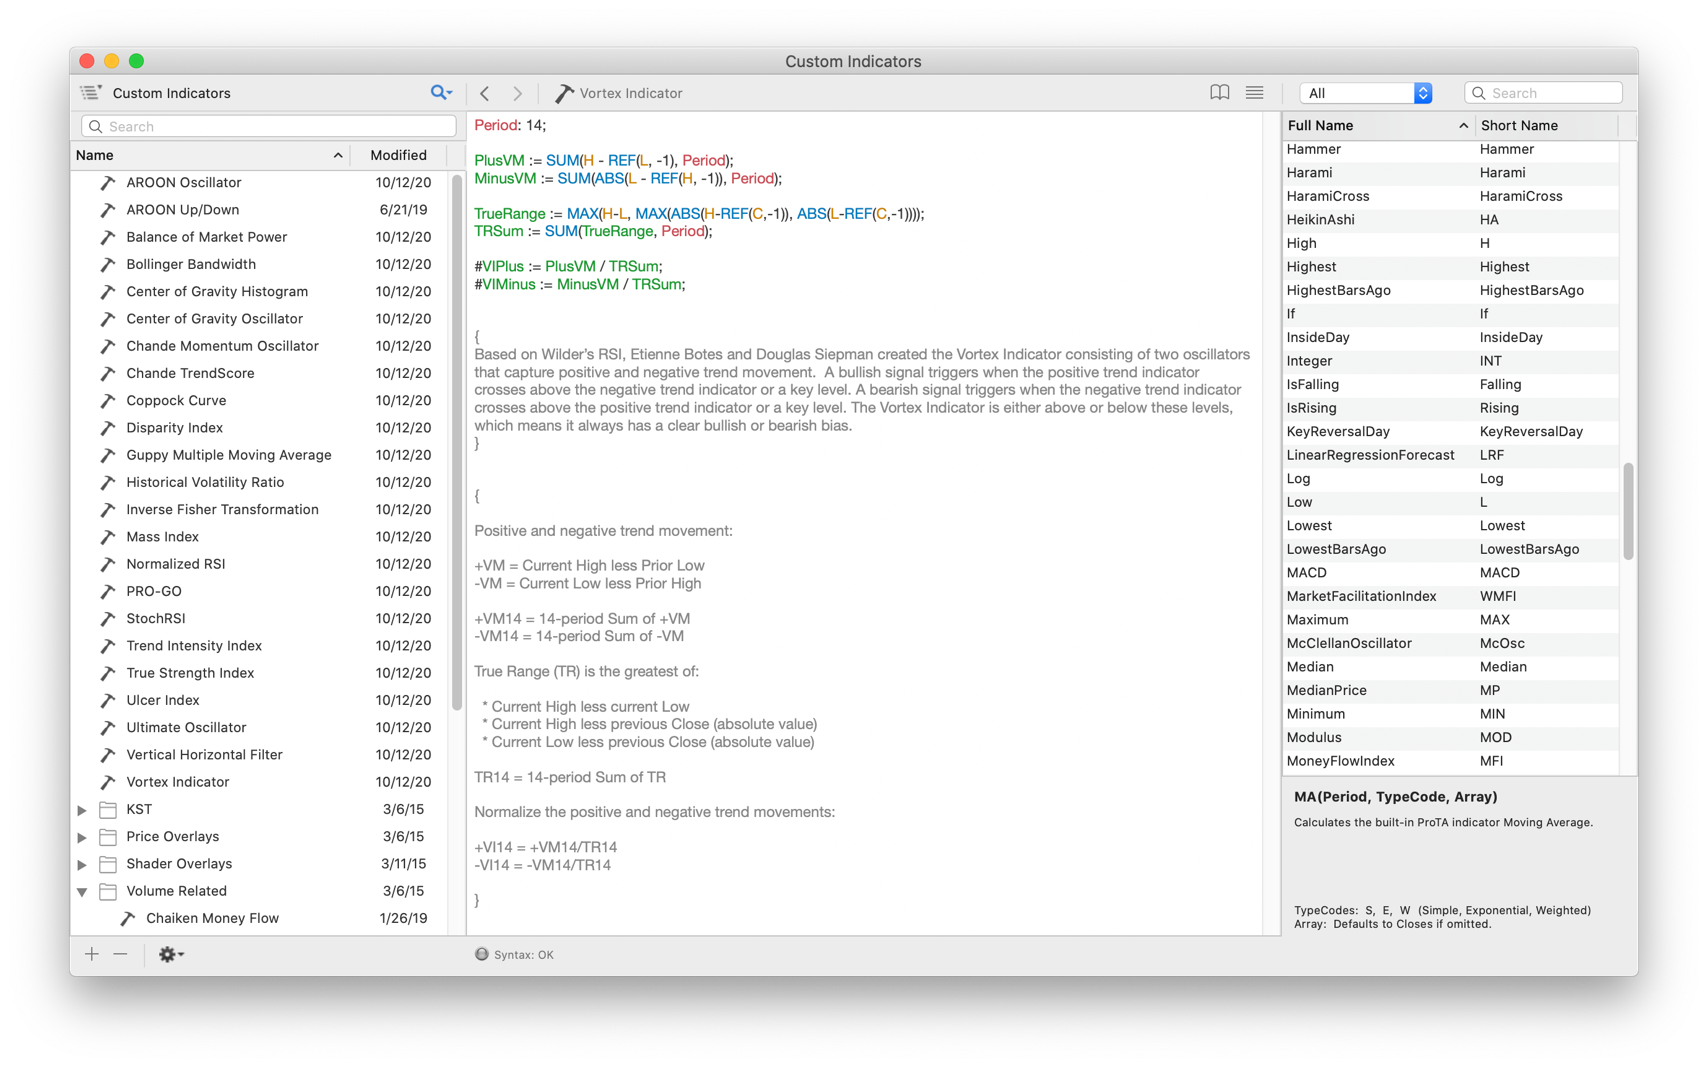
To jump-start your library of custom analysis, ProTA ships with more than 60 Custom Indicators for your use and study. Review the ProTAscript code we’ve written. Edit it, expand upon it, tailor it for your own needs, and if you have any questions turning your ideas into code, we are happy to help!
Write it once, use it often: The same ProTAscript code is used to author your own Custom Indicators, Smartlist criteria and Trading System rules.